K-nearest neighbors
K-nearest neighbors (KNN)
The K-nearest neighbors model, better known by its acronym KNN is an algorithm used for classification and regression tasks. In KNN, a data point is classified or predicted based on the most classes or values of the K nearest data points in the feature space.
For example, if we wanted to predict how much money a potential customer spends in our business, we could do it based on the 5 most similar customers to him and average their likes to make the prediction.
Structure
The model is built according to well-defined steps, which are as follows:
- Selection of the value of
K: A value is chosen forK, which represents the number of nearest data points to be considered for classifying or predicting the new data point. A small value may lead to a noisier model sensitive to outliers, while a large value may smooth the decision boundaries. - Distance measurement: A metric is used to calculate the distance between the data point to be classified or predicted and the other data points in the training set.
- Identification of the K nearest neighbors: The
Knearest data points are selected (depending on the selected metric). - Prediction: If it is a classification problem, the new point is classified into the most frequent class among the
Knearest neighbors. If it is a regression problem, the target value for the new point is calculated as the mean or median of the values of theKnearest neighbors.
Furthermore, the model does not involve a training phase per se, as the entire training set is stored in memory to perform nearest-neighbor classifications or predictions.
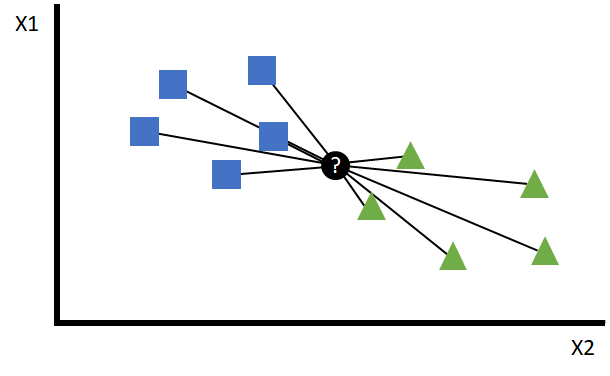
It is important to note that the performance of this model can be highly dependent on the value of K and the choice of distance metric. In addition, it can be computationally expensive for large data sets, since it must compute the distance to all training points for each prediction:

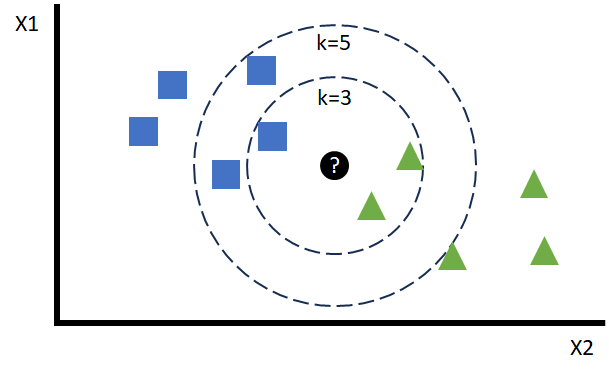
This distance orders the points surrounding the point to be predicted, so that depending on the value of K the closest points can be chosen:

One of the most common questions in this type of models deals with what optimal value of K we should choose. This number cannot be calculated a priori and is approximated in the hyperparameter optimization phase. As can be seen in the case of the figure, its value can bias a particular prediction towards the opposite or another one with slight changes.
Distance metrics
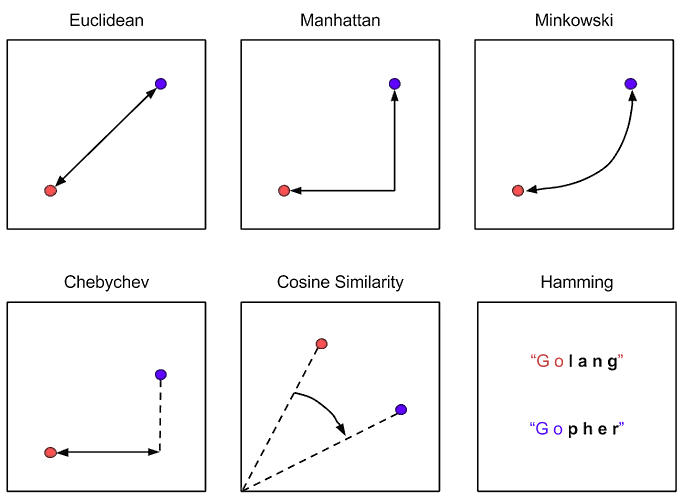
Distance metrics are functions used to measure the proximity or similarity between two data points in a KNN model. There are a large number of proposals, but the best known are the following:
- Euclidean: measures the straight-line distance between two points. Suitable for numerical data.
- Manhattan: Measures the distance as the difference of the Cartesian coordinates of the two points. Suitable for numerical data as well.
- Minkowski: It is an intermediate point between the two previous ones.
- Chebyshev: Also known as the maximum distance between the difference of heights (Y-axis) or widths (X-axis).
- Cosine: Used to measure the similarity between two vectors.
- Hamming: Used for categorical or binary data. It measures the difference between two character strings of equal length.

Model hyperparameterization
We can easily build a KNN model in Python using the scikit-learn library and the KNeighborsClassifier and KNeighborsRegressor functions. Some of its most important hyperparameters, and the first ones we should focus on are:
n_neighbors: This is theKvalue we mentioned earlier. It represents the number of nearest data points to be considered when classifying or predicting a new data point. It is the most important hyperparameter in KNN and directly affects the shape of the decision boundaries of the model. A small value can lead to a model more sensitive to noise and outliers, while a large value can simplify the model.metric: Function for calculating the distance between the data points and the new point. The choice of metric can affect the way the model interprets the proximity between points and, thus, the resulting classification or prediction.algorithm: Different implementations of the KNN model, which will be more or less effective depending on the characteristics and complexity of the data set.