Start interactive tutorial
Example Traffic Simulation on Wordpress using Apache Benchmark
This project seeks to generate artificial traffic from a Kali Linux machine to a website hosted on a Debian server using the Apache Benchmark (ab) tool. Additionally, monitoring tools will be implemented on the server to detect traffic surges and evaluate its performance.
🌱 How to start a project?
Do not clone any repository! Just follow instructions below:
To carry out this project, we will need 2 virtual machines:
- One will be the Debian virtual machine where we previously built the WordPress website.
- The other will be the Kali virtual machine as the attacker. If you have not installed Kali Linux yet, please follow these instructions: Installing Kali Linux on a virtual machine.
Requirements
- Oracle VirtualBox
- Virtual machine with Kali Linux (Attacker): To generate traffic.
- Virtual machine with Debian (Web Server): Where we have the Apache server and the WordPress site hosted.
📝 Instructions
Step 1: Configure the Network in VirtualBox
Configure the Network of the Debian Machine (Web Server)
Configure the Network of the Kali Linux Machine (Attacker)

Step 2: Obtain the IP Address of the Machines to Connect Them.
With "Bridged Adapter" configured, the machines should automatically obtain an IP address from your router or network's DHCP server.
On the Debian Machine (Web Server)
Look for the section corresponding to your network interface (usually eth0 o enp0s3) and find the line that starts with inet. There you will see the assigned IP address, something like 192.168.1.x.
On the Kali Linux Machine (Attacker)
Look for the section corresponding to your network interface (usually eth0 o enp0s3) and find the line that starts with inet. There you will see the assigned IP address, something like 192.168.1.x.
Step 3: Verify the Connection Between the Machines
From the Kali Linux Machine (Attacker):
1$ ping <IP_debian>
Replace <IP_debian> with the IP address you obtained for the Debian machine.
From the Debian Machine (Web Server):
1$ ping <IP_kali>
Replace <IP_kali> with the IP address you obtained for the Kali machine.
Graphical example of how the pings look when connected:

Step 4: Simulate Traffic on the Website
On the Kali Linux Machine (Attacker):
We will use Apache Benchmark (AB) as a tool to generate traffic on the website.
Installation and Usage of Apache Benchmark
Apache Benchmark (AB) is a tool that allows you to generate test traffic to a web server. Follow these steps to install and use ab from Kali Linux:
- Installation of Apache Benchmark
1$ sudo apt-get update
2$ sudo apt-get install apache2-utils
- Generate Traffic to the Website
1$ ab -n 1000 -c 10 http://<IP_debian>/
The command ab -n 1000 -c 10 http://<IP_debian>/ hwill make Apache Bench send 1000 HTTP requests to the web server at http://<IP_debian>/, with 10 requests being made concurrently, simulating 10 concurrent users accessing the server..
NOTE: Replace <IP_debian> with the IP address of the Debian server.
Step 5: Monitoring Server Performance
On the Debian server, we are going to install monitoring tools like htop to observe the performance during the tests.
Installing htop
1$ sudo apt-get update
2$ sudo apt-get install htop
Real-Time Monitoring with htop
htop is an interactive process monitoring tool that provides a detailed view of the system resource usage.
1$ htop
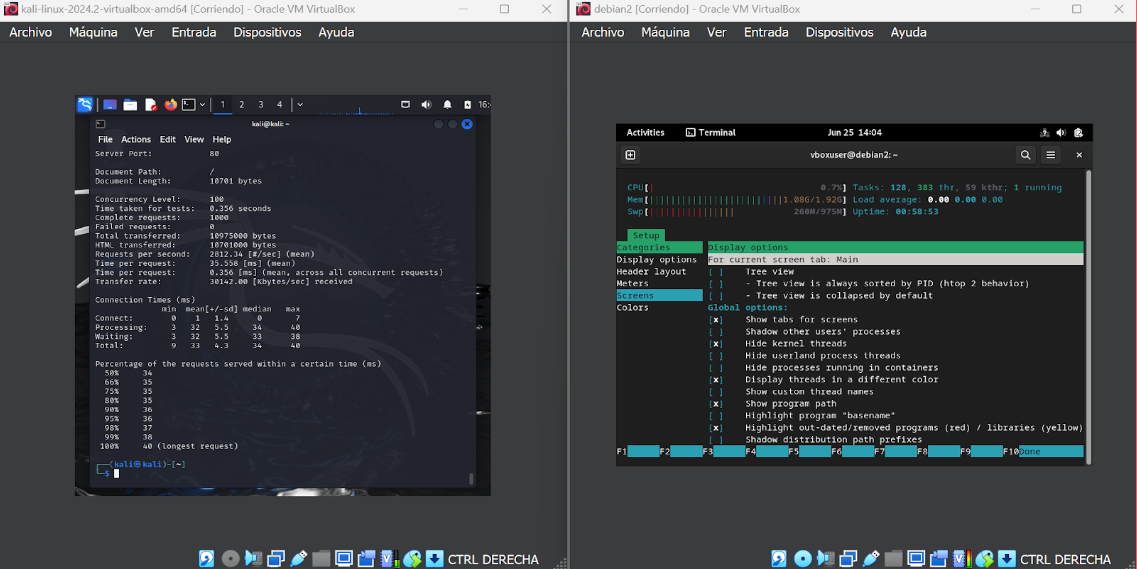
You will see something like this:

- CPU Usage: Shows real-time CPU usage, usually divided into bars representing each CPU core.
- Memory Usage: Displays RAM and swap memory usage.
- Tasks: Lists active processes with details such as PID, user, CPU and memory usage, runtime, and the command that started the process.
- Load Average: Shows the system load average over the last 1, 5, and 15 minutes.
- Uptime: Indicates how long the system has been running since the last reboot.
Project Delivery
In the cloned repository, you must submit 2 reports.
1$ ab -n 5000 -c 200 http://<IP_debian>/ > report_ab.txt
Copy these lines into the
report_htop.txtfile and fill in the corresponding information.
1  observations:
2  evaluation_if_server_could_handle_load:
3    - performance_metrics:
4        - stable_memory: # Here you can note how many requests per second maintained stable memory usage
5        - cpu_load_average: # Here you can note what average CPU load percentage was maintained
6
7  specification_of_excessive_resource_usage:
8    - cpu_peak_usage:
9        - observed: true  # Indicate if a CPU usage peak of 90% was observed during the first few minutes of maximum load (the value would be true or false)
10        - peak_percentage: 90
11        - request_count_at_peak:
12            - value:  # Here you can note the specific number of requests at which the peak occurred