web-development
debugging
HTML and CSS
Debugging HTML Code
HTML Code is difficult to debug initially, but it's easy to grasp if you follow this recipe. You only need to know 2-3 things before starting to code or debug in HTML that will make you a master. Yes, it's that easy, so don't worry and keep reading.
If you are interested in debugging other languages or technologies, here is our full guide about what is debugging and how to become a master of debugging when coding front-end and back-end web development.
Preventing errors
This guide is about fixing a bug, but it's worth mentioning how to prevent the majority of the bugs in the first place:
- ABC = Always Be Closing the tags as a priority. If you open a tag
<p>, close it immediately! Like this:<p></p>, and then proceed to fill the inner HTML content. - Use a code formatter that indents your code automatically. Most of the bugs at first come because your code is messy and challenging to follow with your eyes. You end up opening/closing tags in the wrong place.
Three Debugging tools for HTML
The most effective debugging tools for HTML are:
- Your page HTML source code as the browser sees it.
- The developer tools inspector.
- Your coding editor (VSCode, JetBrains, etc.).
Let's go over each of them in detail.
1) Inspecting the HTML source code
You may assume that the code you wrote is the one being displayed by the website. NOPE! There are multiple reasons why your original code may not match the source code being used on the website.
- Browser Cache (the most common cause): Your browser sometimes keeps an old version on purpose.
- Server-side dynamic rendering: Using a server-side language to manipulate the source code before it arrives in the browser.
- Server configuration: The server may be removing or adding some extra lines of code.
What is the Browser Cache
Sometimes the browser will use an old version of the code instead (cache memory). This is called: Browser Cache. Caching can be a common source of confusion for junior developers, leading to changes not appearing on the website as expected.
Cache errors: You need to ensure the code you wrote is the same code rendered to your website.
Make sure to disable browser cache in the developer tools. Also, get used to holding the
shiftkey when refreshing a website during development.
How to inspect the HTML source code:
- In Windows, open the source code by pressing the
Ctrl+Ukeys. - On Mac, open the source code by pressing the
⌥ Option+⌘ Command+Ukeys.
2) Developer Tools Inspector
Every major browser has Developer Tools. The first tab in the developer tools is called "Elements", and it contains -almost- everything you need to fix your bugs.
The Dev Tools Inspector shows a live version of your code instead of your original source code. This "live version" is called "The DOM". It's what the browser was able to interpret from your code. These are some cases that make the inspector great:
- If your website is not looking how you intended: Use your mouse right-click menu and look for the "inspect" option. It will show the HTML elements that the browser created around that area.
- If you have written incorrect HTML code: The browser will attempt to fix it to make it display correctly, but this may only sometimes result in the desired layout. When you use the developer tools inspector, you will see the HTML code that the browser interprets, which may be different from the original source code if the browser has made any corrections.
Note: There are other -more advanced- examples where the Inspector HTML won't match your source code; you can open these details to read more about them.
-
Minification: Sometimes, websites compress and optimize the code for faster loading times. The HTML inspector will show the minified code, which may be difficult to read.
-
Browser extensions: Ad blockers or script blockers modify the code shown in the HTML inspector.
-
Server-side rendering: the HTML inspector will show the code rendered on the server rather than the source code.
3) Debugging HTML inside your Coding Editor (IDE)
The last crucial debugging tool for HTML is your coding IDE (editor). Most of the IDEs offer the following features:
- Syntax highlighting: Colors help visually distinguish different parts of the HTML code, such as tags, attributes, and values, making it easier to spot errors.
- Linting: Some editors have built-in linters that can check your HTML code for errors and potential issues and highlight them in the editor.
- Validation: Some editors can validate your HTML code against the W3C standards and display error messages if there are any issues.
HTML most common errors and how to debug them
Unclosed tags
If a tag is not closed correctly. For example, if you forget to close a <div> tag: The code editor might highlight the entire block of code that follows the unclosed tag in red. You can also see the error in the terminal if you use plugins like prettier. If you click on an opening tag, the editor will also highlight the closing tag.

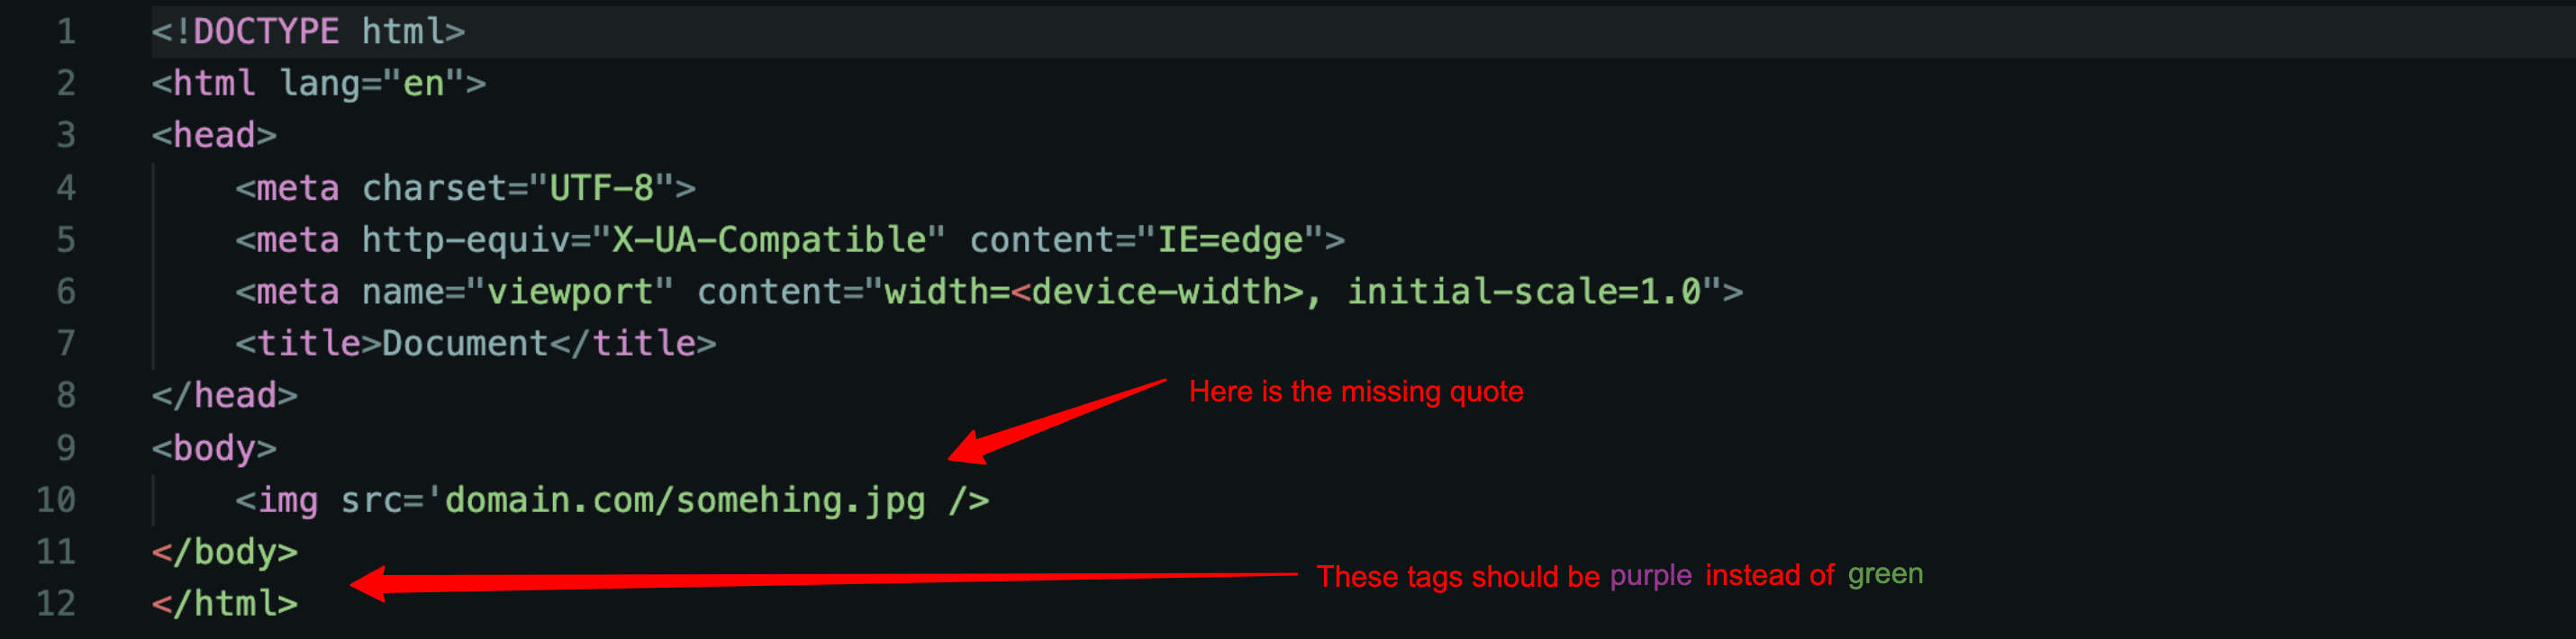
Missing quotes
HTML tags have attributes, for example, the <img> tag has a src attribute: <img src="https://domain.com/something" />. Unfortunately, sometimes we make mistakes when opening or closing those tags.
To find those errors, the best tool is the syntax highlighter. It will show weird coloring; look at this image for a better understanding.
Bad <link> or <script> tag URL
This is funny because everyone makes this mistake, I did it, you did it or will do it, and everyone else did it or will do it.
When linking your HTML to a separate CSS file or JavaScript file, you might type the wrong URL, and your stylesheet won't load.
How do you know your link tag is wrong? The Dev Tools Inspector console will show a 404 error like this (look at the image below):

Note: It shows the URL it used to retrieve your stylesheet; check that the URL is OK.